Introducing sequenchr
R package for EDA and unsupervised learning of categorical sequence data
Sequenchr is a sequence analysis tool for applied researchers. It is designed to enable faster analysis iterations and is also great for those who prefer an interactive interface. The core of the package is the interactive Shiny app but the majority of the underlying functions can be accessed directly through R.
Installation
The package is available through GitHub and can be installed via devtools.
devtools::install_github("joemarlo/sequenchr")
Launching the sequenchr Shiny app
Sequenchr is built on top of the powerful sequence analysis package TraMineR which provides a number of helpful functions to manipulate and analyze sequence data.
The sequenchr Shiny app requires a TraMineR object created from TraMineR::seqdef. For more information on using TraMineR, see http://traminer.unige.ch/. Once the TraMineR object is created, calling sequenchr::launch_sequechnr will launch the Shiny app in a new browser window.
library(TraMineR)
library(sequenchr)

# load data and convert to a sequence object
data(mvad)
seqstatl(mvad[, 17:86])
mvad.alphabet <- c("employment", "FE", "HE", "joblessness", "school",
                   "training")
mvad.labels <- c("employment", "further education", "higher education",
                 "joblessness", "school", "training")
mvad.scodes <- c("EM", "FE", "HE", "JL", "SC", "TR")
mvad.seq <- seqdef(mvad, 17:86, alphabet = mvad.alphabet, states = mvad.scodes,
                   labels = mvad.labels, xtstep = 6)
# launch the sequenchr app
launch_sequenchr(sequence_data = mvad.seq)
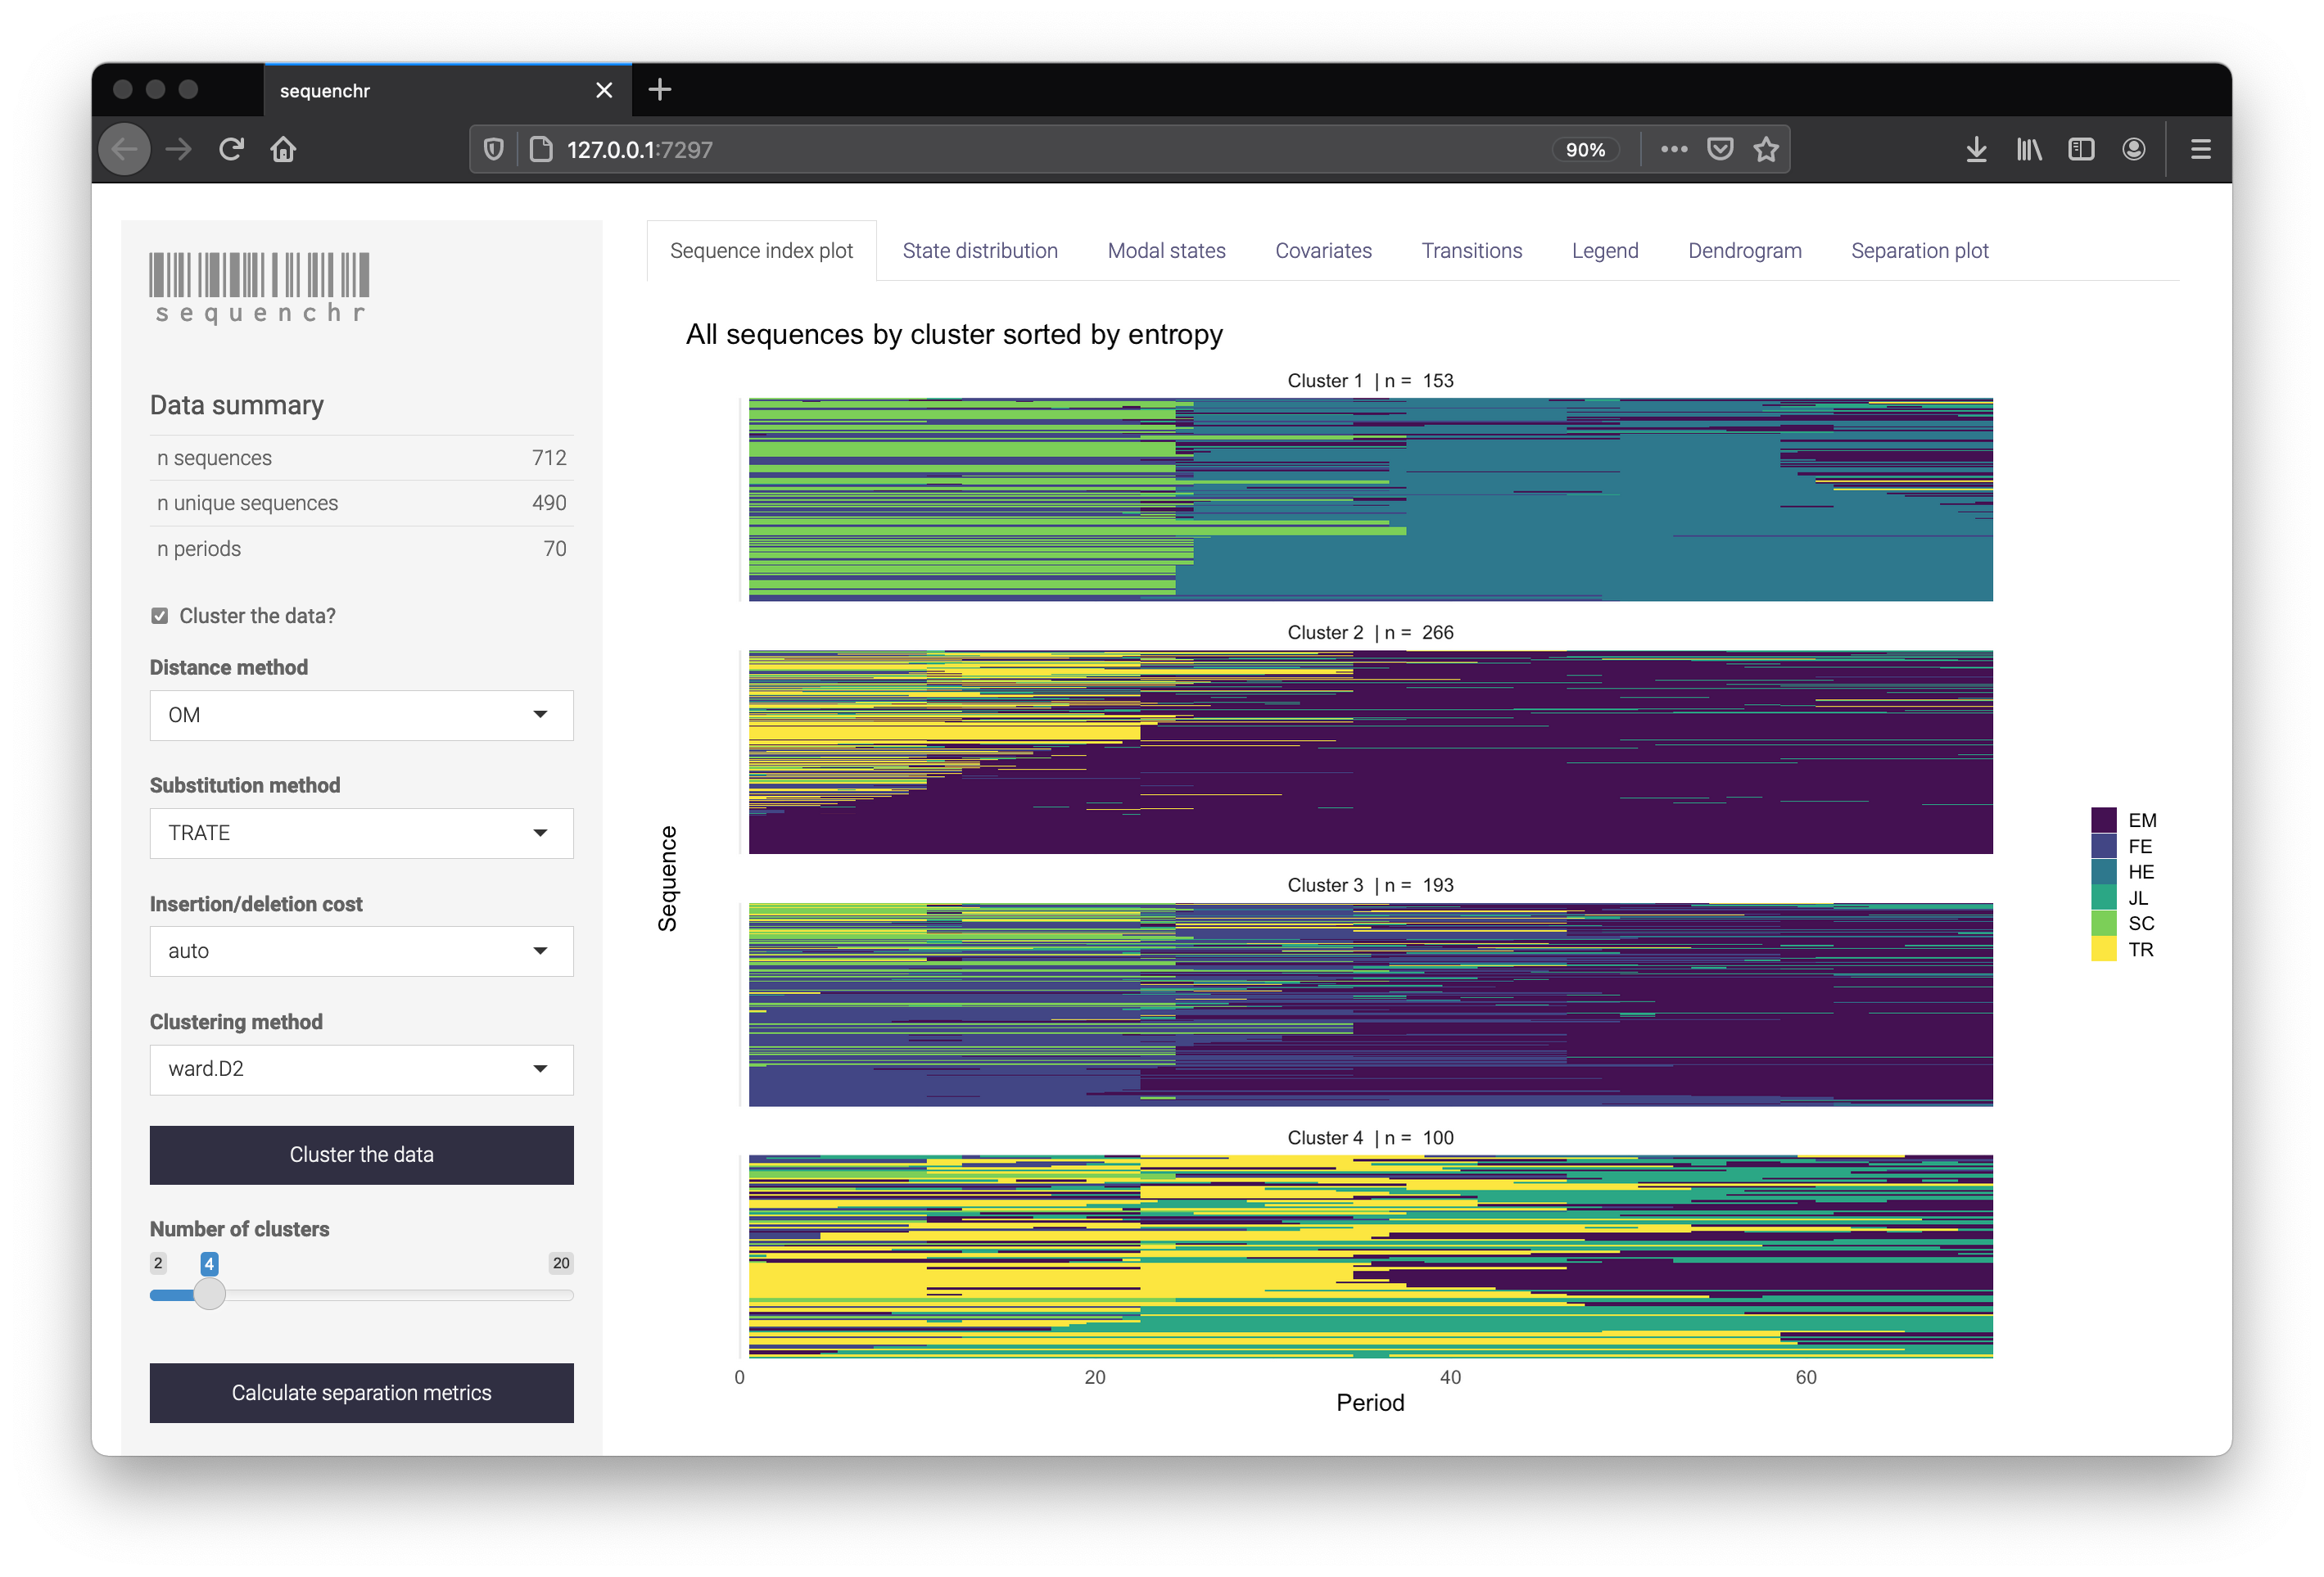
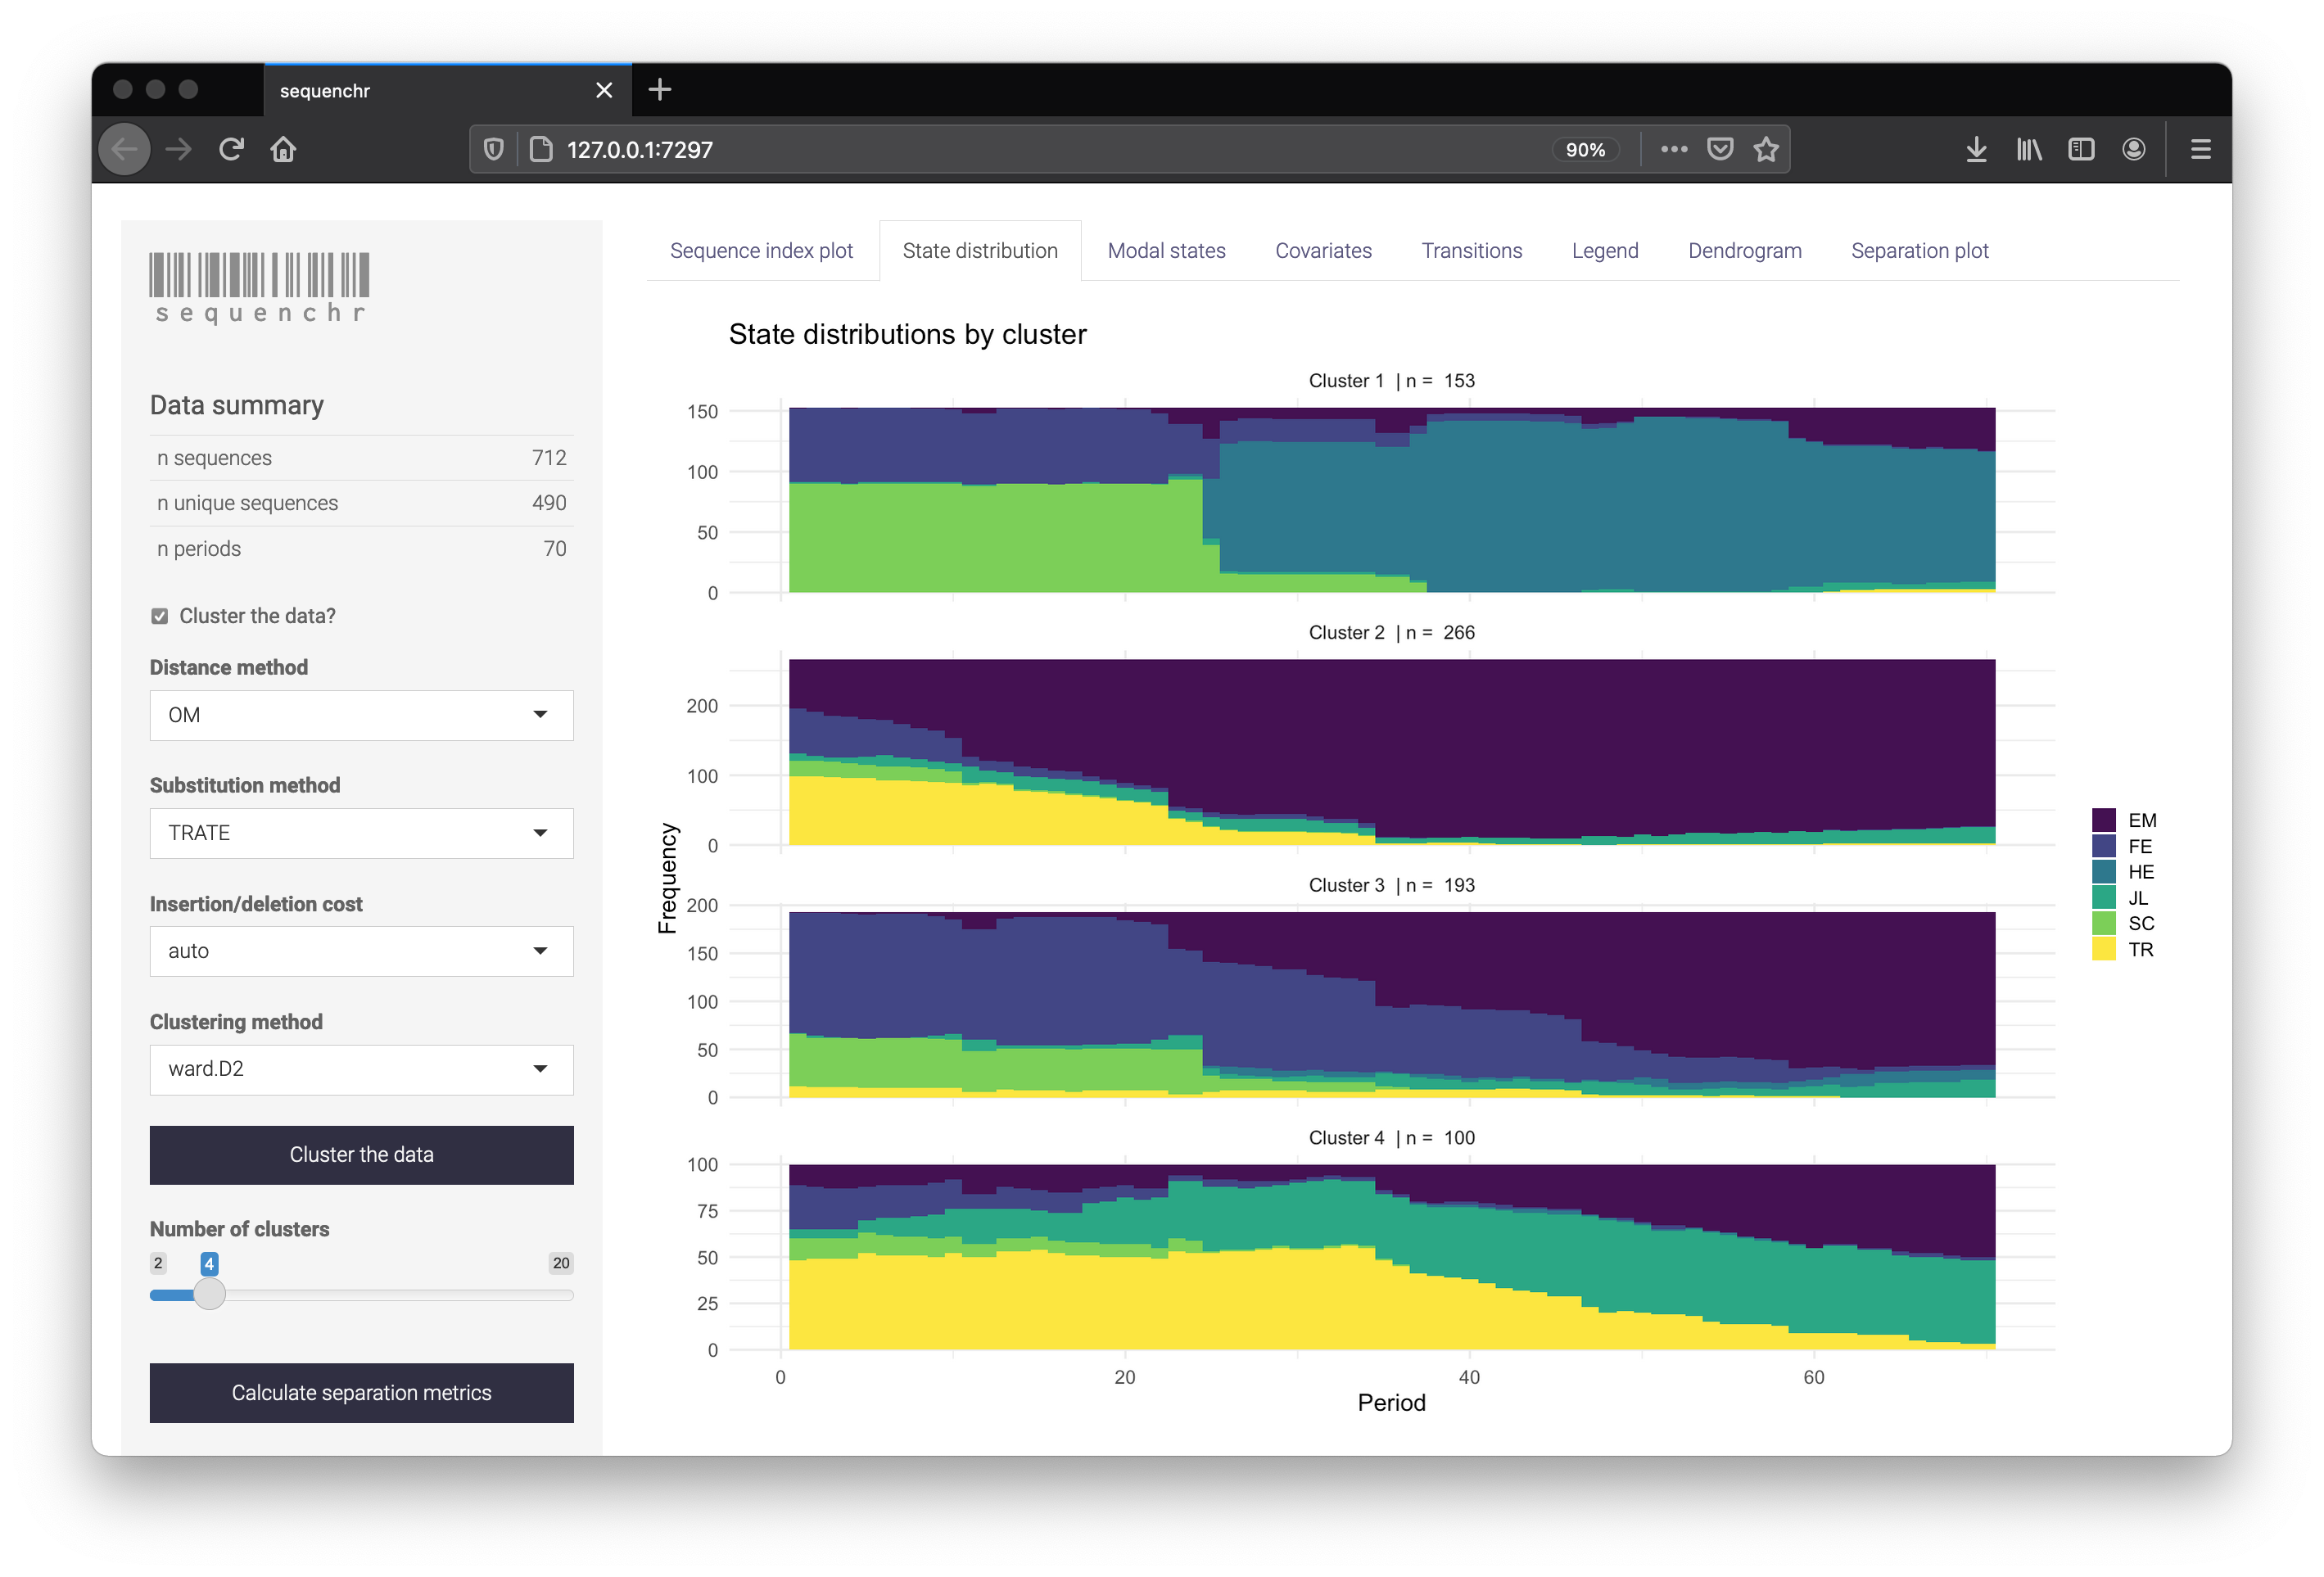
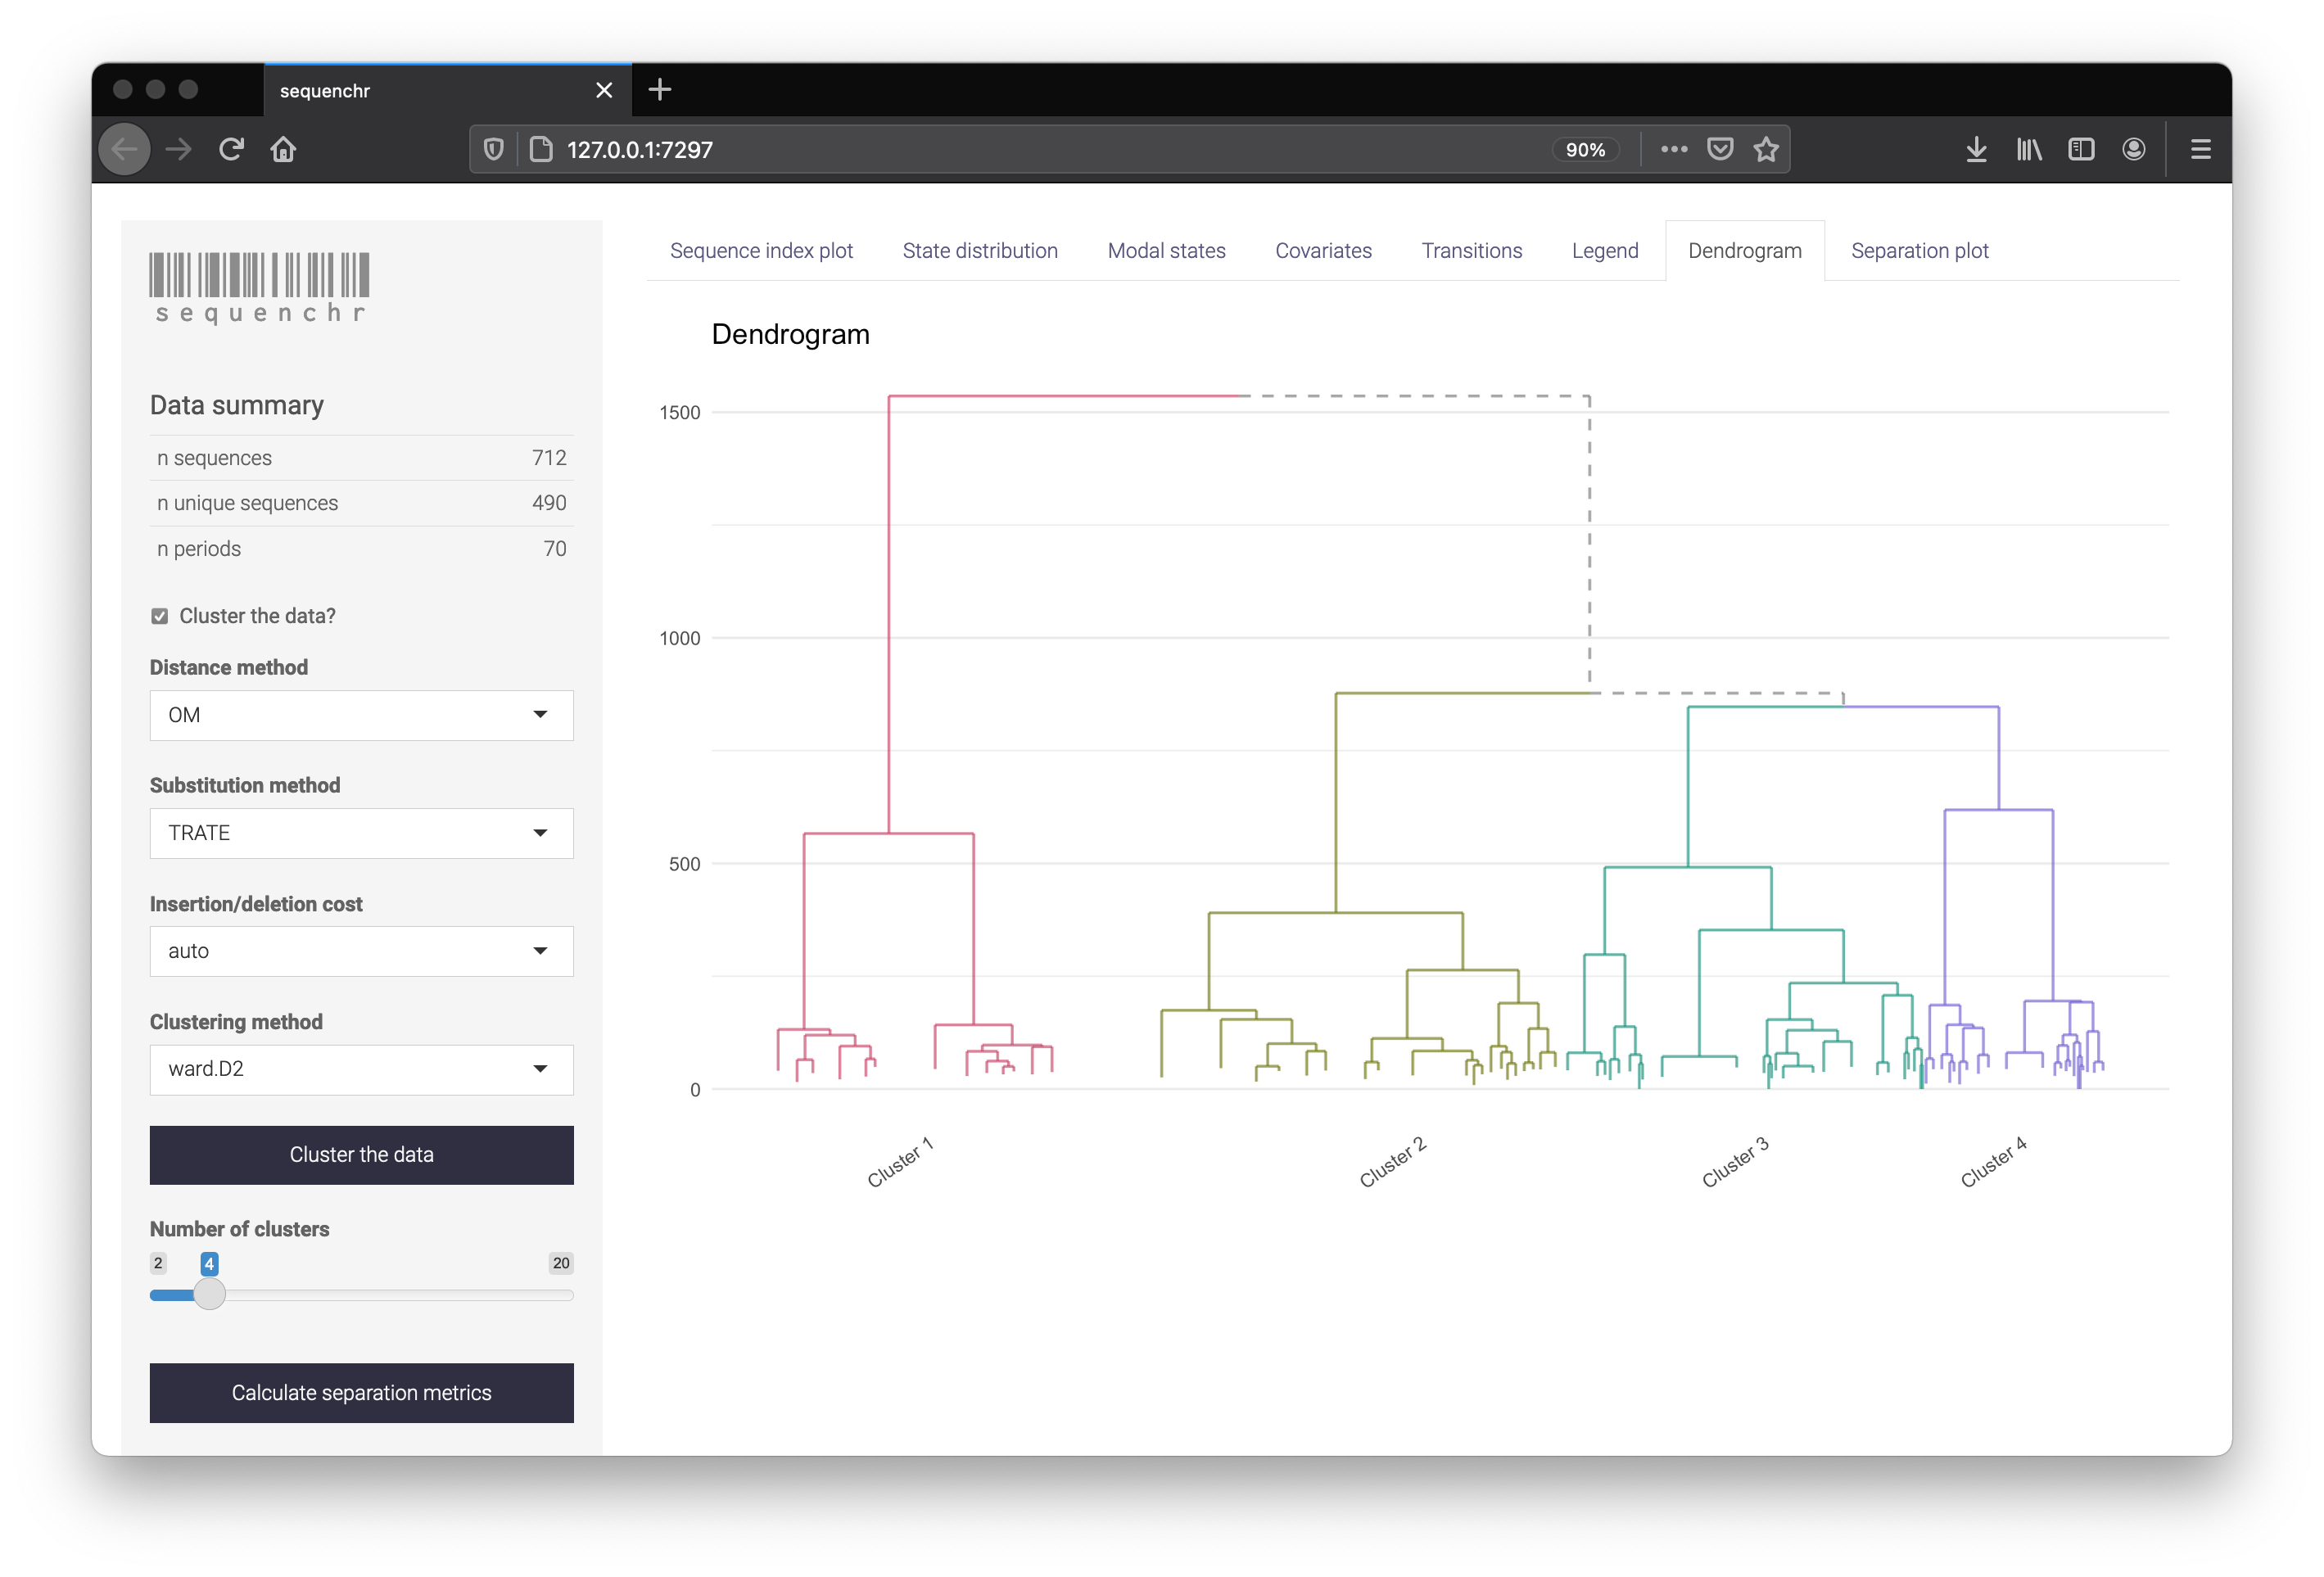
The sequenchr app displays plotting of the state sequences and hierarchical clustering. Distance methods, clustering methods, and separation metrics can be specified on the left side. Cluster labels can also be downloaded as a .csv if you wish to use them directly within R.
Using the functions directly
The functions that power the sequenchr app can also be used directly. All plotting functions start with sequenchr::plot_* and most require a tidy dataframe created from the TraMineR object.
The tidy dataframe is created via sequenchr::tidy_sequence_data and then is passed to the sequenchr::plot_* functions.
# tidy the data
seq_def_tidy <- tidy_sequence_data(mvad.seq)
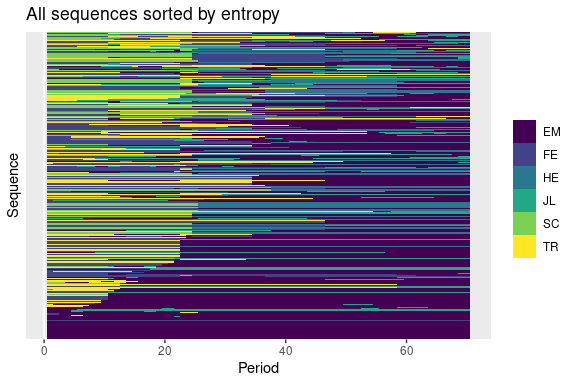
# plot the sequence index
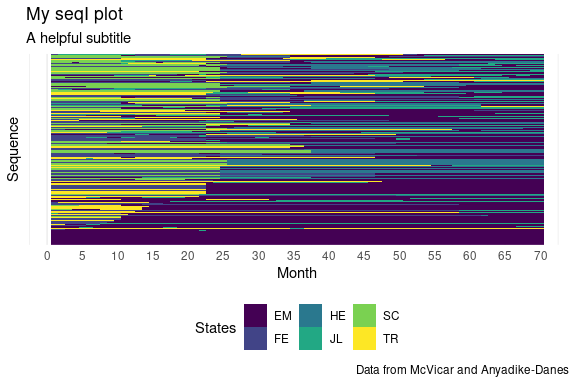
plot_sequence_index(seq_def_tidy)
Modifying plots
Plots are standard ggplot2 objects and can be customized using ggplot2 syntax. For example, the theme, scales, and labels can be modified by calling their respective functions on sequenchr::plot_* output, concatenated with ‘+’.
library(ggplot2)
theme_set(theme_minimal())
p <- plot_sequence_index(seq_def_tidy)

p +
  scale_x_continuous(breaks = seq(0, 70, by = 5)) +
  labs(title = 'My seqI plot',
       subtitle = 'A helpful subtitle',
       x = 'Month',
       fill = 'States',
       caption = 'Data from McVicar and Anyadike-Danes') +
  theme(legend.position = 'bottom')
Read more about sequenchr by viewing the vignette
devtools::install_github("joemarlo/sequenchr", build_vignettes = TRUE)
vignette('sequenchr')
2021 March
Find the code here: github.com/joemarlo/sequenchr