Predicting Citi Bike stock in real time — on the cheap
Extracting the best from Python and Shiny
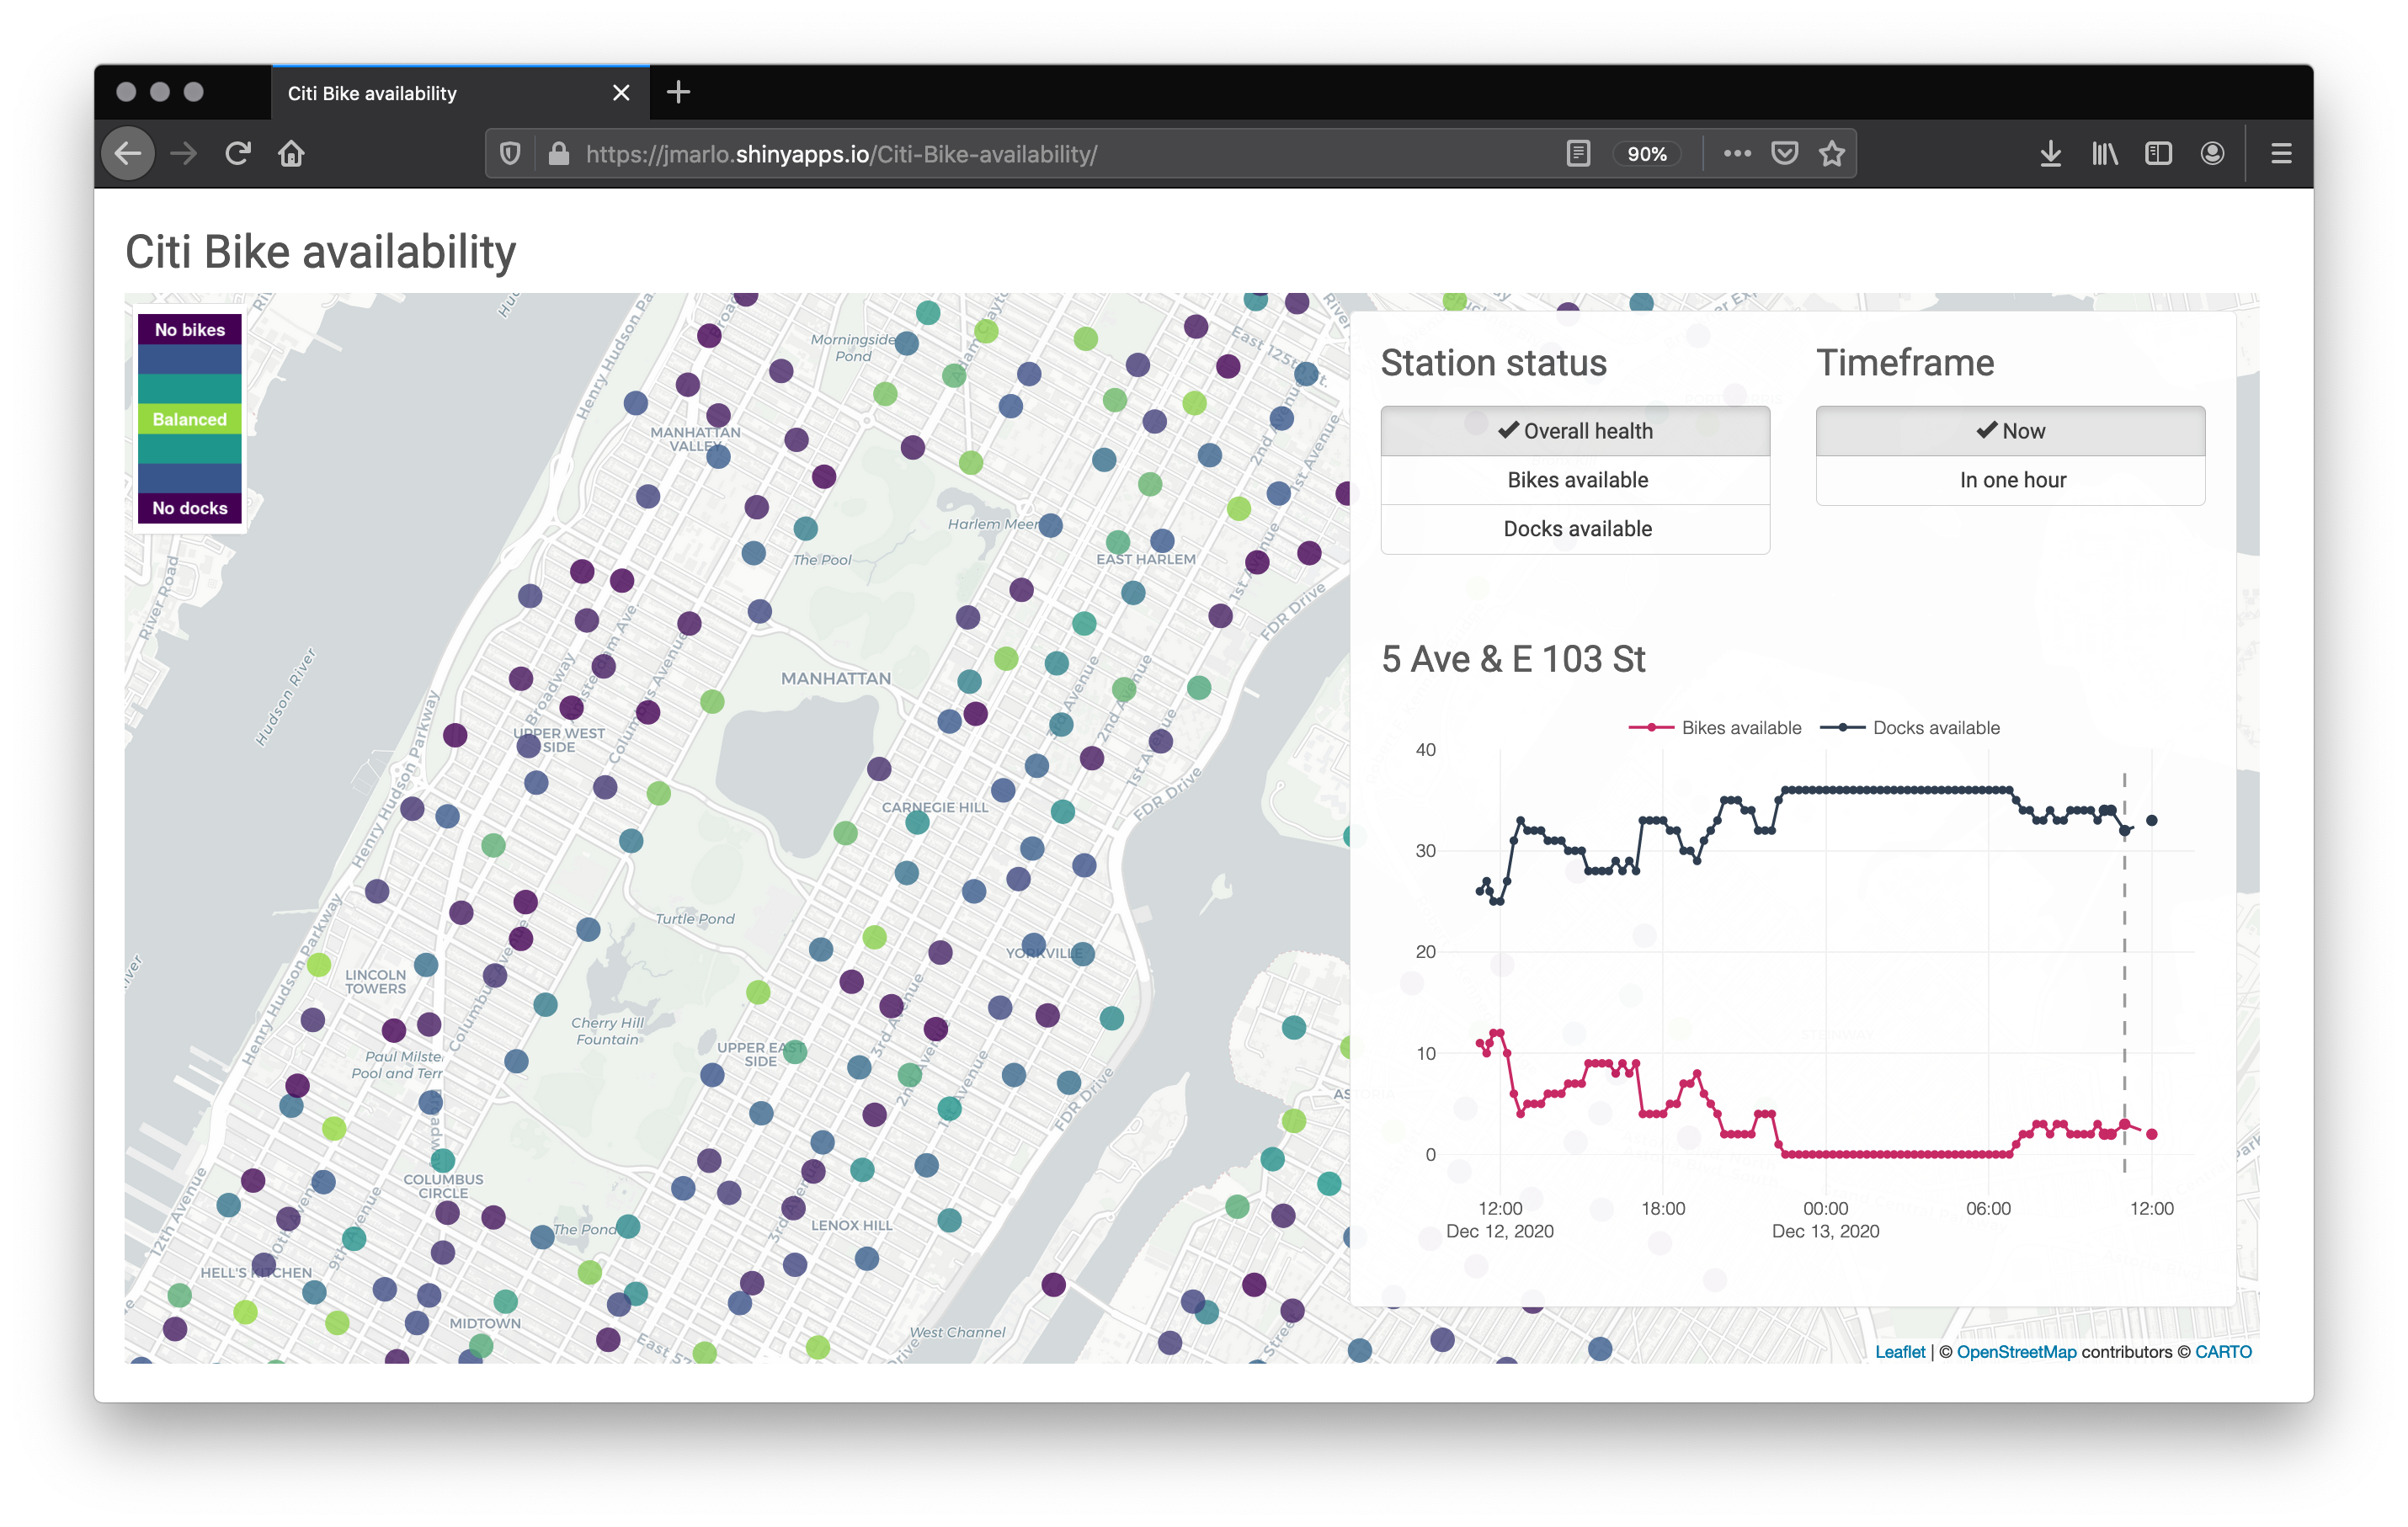
The Citi Bike service is a ubiquitous feature of NYC, and the pandemic has perhaps elevated it to one of the primary modes of city transportation for many residents. Finding available docks to park your bike can be difficult though. I have created a live map of the Citi Bike stations that displays their current stock and their predicted stock in the next hour — perfect for figuring out where you can find an available bike for your next ride or an open dock at the end of your ride. The map is live here (defunct as of March 8, 2021 due to expiry of Azure student credits).
The map is built using the best of Python and R Shiny. The former provides the modeling pipeline and the latter a simple frontend. It is all glued together using a Raspberry Pi, a cron job, and an Azure server. The free Shinyapps.io plan and $100 in Azure student credits makes this a $0 out-of-pocket project.
Creating it
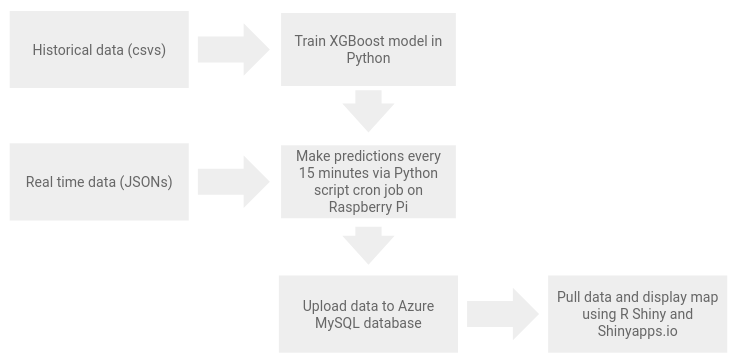
The biggest hurdle was setting up a framework to digest the live data and somehow get it to the Shiny app. The modeling and Shiny app design are straightforward and aim to be as light as possible.
Citi Bike provides a real time JSON feed of the current data using the General Bikeshare Feed Specification format. This is easily parsed by Python and Pandas. Predictions can be made using your model of choice. I have used a XGBoost model; admittedly the modeling process could benefit from a little extra effort, but the focus of this project was on building a working pipeline, not a perfect model. The model still produces an RMSE of approximately two bikes, and, importantly, places little strain on the Raspberry Pi 1.4GHz ARM with 1GB of memory. An ARIMA model or RNN could be a good 2.0 option for these time-series data.
The Python prediction script is automated to run every 15 minutes using cron. I recommend using crontab.guru for help parsing the crontab syntax. And finally the data is uploaded to an Azure database running MySQL. R Shiny connects to the database in the typical R way. Data is visualized using leaflet and ggplotly.
The full process is summarized into a simple diagram:
It’s a bit cheating to say that Azure costs $0 due to the student credit. If you are running on a tight budget and do not have a large dataset, Dropbox and rDrop2 package can be swapped for the Azure database. The downside is all the data will be pulled into memory by the Shiny app. Google Drive and googledrive package could also provide a similar solution.
The end product is satisfying: an automated process and a simple web interface to access helpful information for real daily decision making. Separating out the Python and R Shiny parts is a nice and tidy solution. The only interaction between the two is indirectly through the MySQL database. One could go a step further and replace Shiny with Dash or Bokeh. Either way, Python and Shiny’s respective strengths are showcased well here. And it’s a great side project for that Raspberry Pi many people have laying around.
2020 December
Find the code here: github.com/joemarlo/citi-bike-availability