Who spends their day just like you?
Finding similar sequences of categorical data
How people spend their time is fascinating. It is our most precious resource and consequently our time-use reflect our priorities. Finding people who spend their days similar to our own can be enlightening — both because it’s intrinsically interesting and so we can understand ourselves through the lens of others.
A single day’s time-use can be represented as a string of activities. Here, every hour is depicted by a rectangle and its activity by a color.
This prototypical day tells us the person works a roughly 9-5 day and spends their free time relaxing or socializing. They most likely are not in school and do not have children requiring care. As a result it can be presumed they have a steady full time job, are college educated, and make above median income.
Answer the questions below to see who spends their day similar to you. The question-series yields common weekday sequences that may match your own; however the sequences are entirely editable to fit your exact day.
How do you usually spend your weekdays?
Do you work?
When do you start work?
Are you a student?
Hmmm, which activity most defines your day?
Is this how your day roughly looks? Customize by clicking each square
Now let's find people similar to you
Who are these people?
The below plots reflect the above 25 individuals measured on six attributes. The heights of the bars represent the frequency for that category.
How does this work?
In short, a day’s time use activities are reduced to a single string of characters and the edit distance between the strings is computed. More similar days have smaller distances.
Edit distance methods
There are many choices of edit distance method. Most rely on counting the number of insertions, deletions, and substitutions to transform one string to the other — with each method stipulating different costs for each operation. The below four are some of the most common:
- Hamming: only allows substitution
- Longest common sub-sequence (LCS): only allows insertions and deletions
- Dynamic Hamming: only allows substitutions but costs depend on position within the sequence
- TRATE: costs derived from observed transition rates
Each of these have advantages and disadvantages. For the use case here, dynamic Hamming produced the most interesting clusters: it captured both the unique sequencing of the activities and their timing within the day.
This speaks to the main advantage of sequence techniques over comparing simple sums of time-use activities; the sequence techniques incorporate not just the prevalence of the activity but also when they occur within the day and which activities precede and follow.
Clustering
The data comes from the American Time Use Survey covering over ~200,000 interviews between 2003 to 2018. The original ~100,000 weekdays of data needs to be condensed down into a dataset small enough to be quickly loaded by the browser.
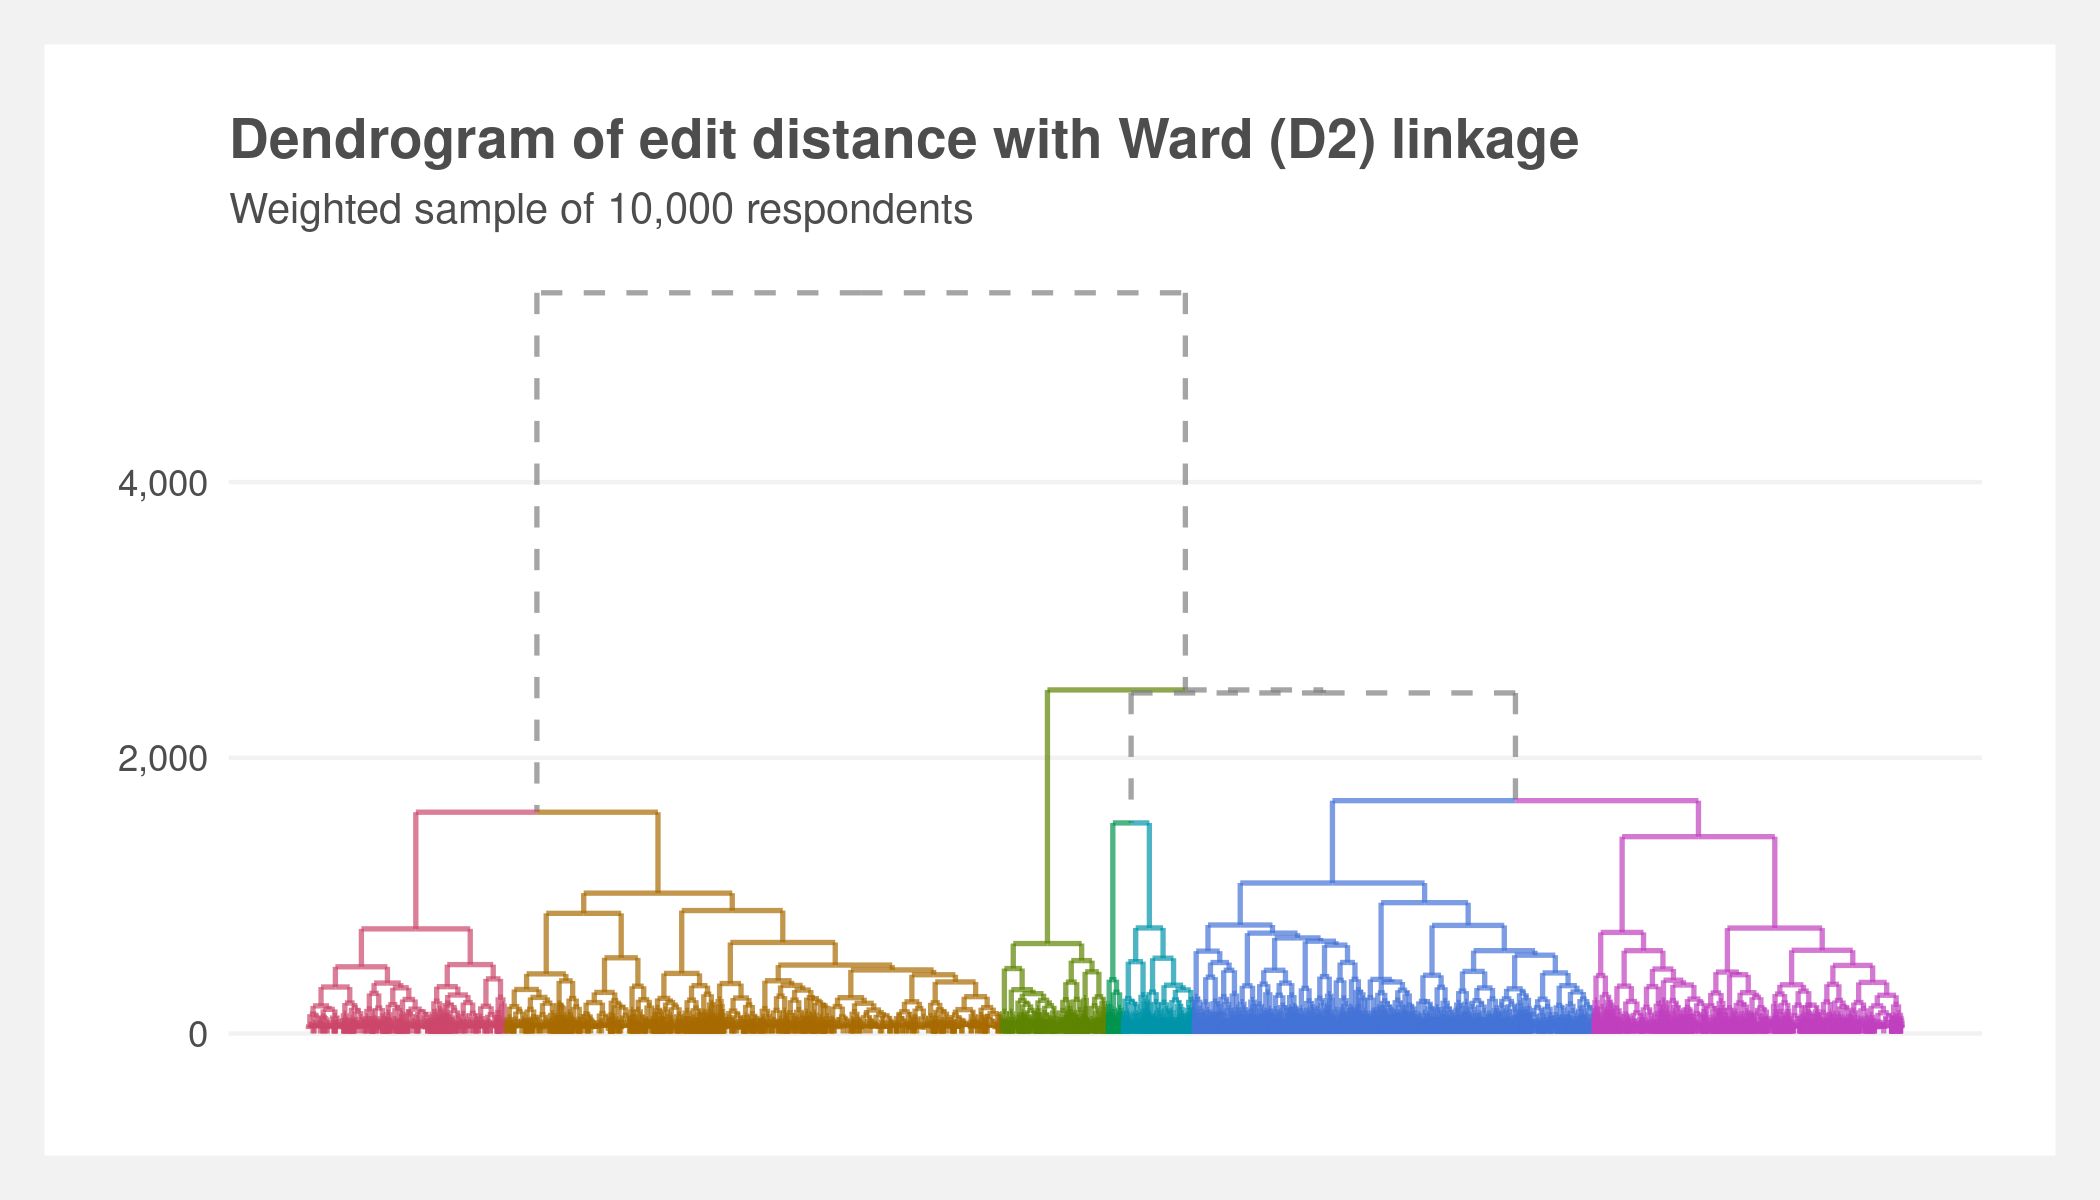
Hierarchical clustering based on the edit distance is used to discover the seven most interesting and distinct clusters. While a smaller number of clusters results in the best cohesion-to-separation (measured via silhouette width), seven clusters provides the best balance between the numerical measure and subjective interpretations of cluster distinction.
The below dendrogram shows distances between the observations and how they coalesce at varying cluster k values. The colors represent the seven clusters.
Each cluster’s individual sequences reveal what makes the clusters differentiable. Cluster 1 consists of mostly socialites/relaxers; cluster 2 night workers; cluster 3 household activities; cluster 4 students; cluster 5 morning workers; cluster 6 early-morning workers; and cluster 7 evening workers.
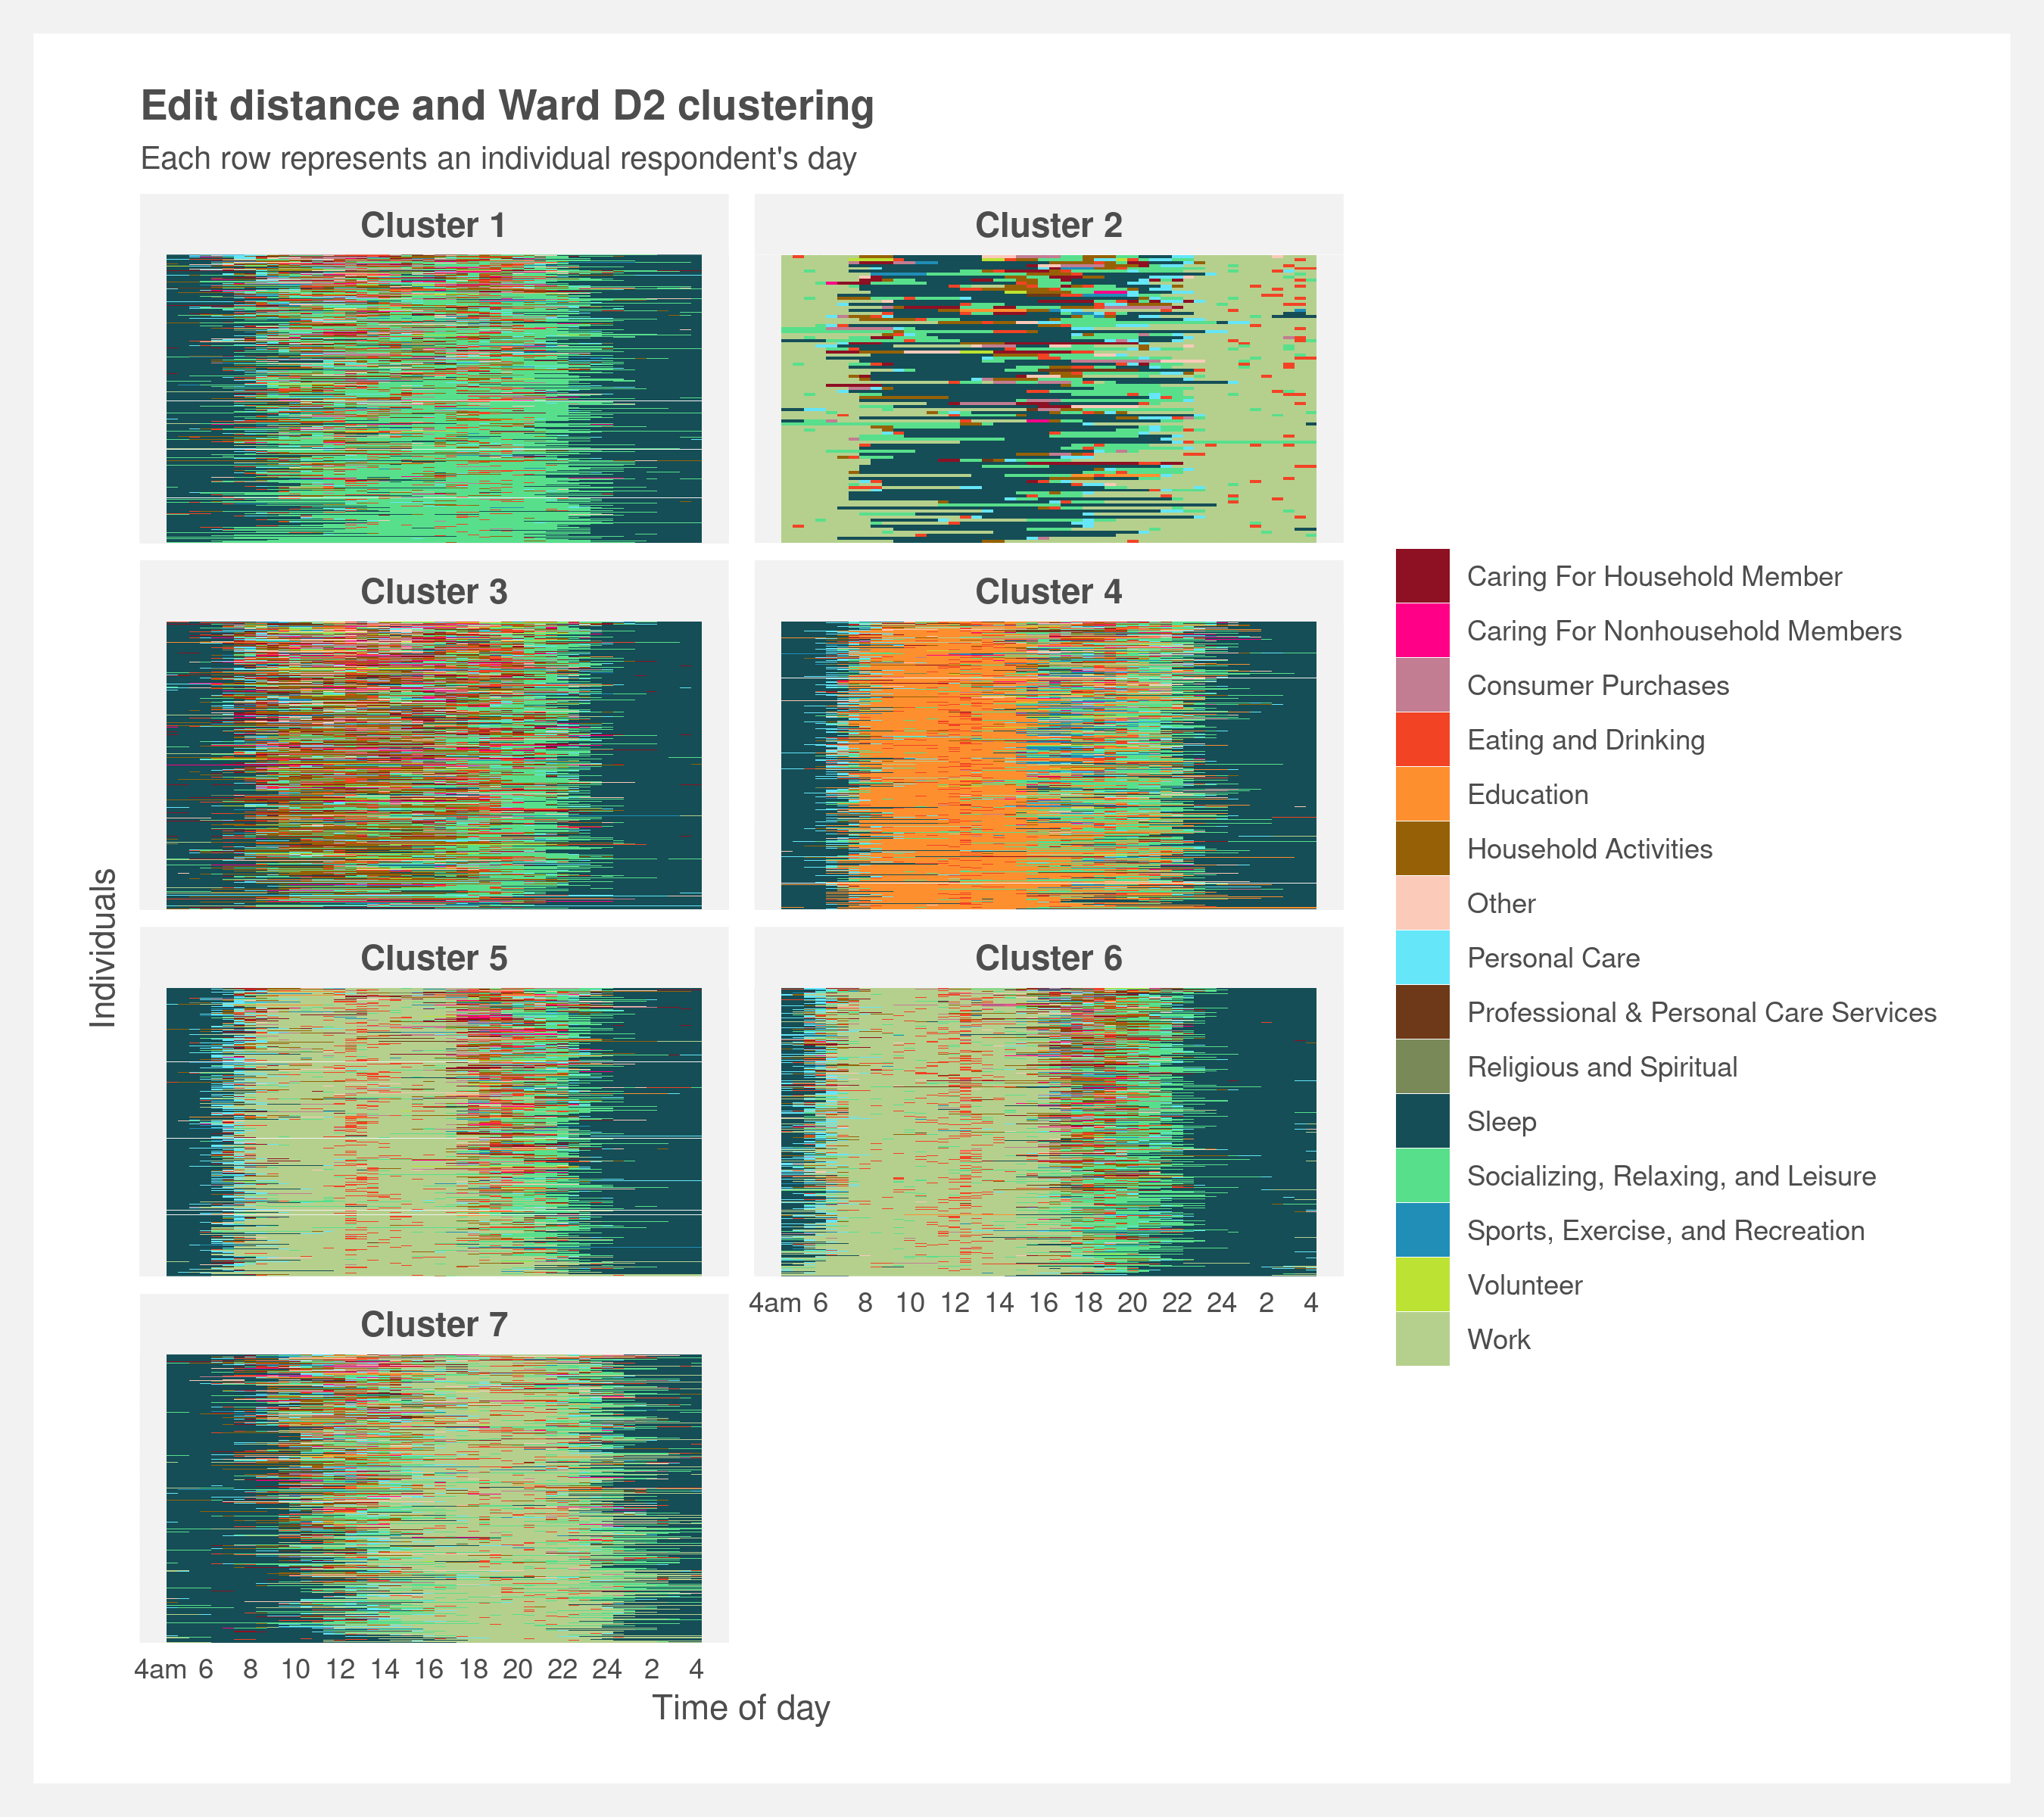
The clusters are simplified to their modal sequence. These modes are used as the first step to classify the user’s input. The user input is first matched to the closet modal sequence (based on edit distance) and then matched to the top 25 sequences of 400 potential sequences that are a priori stratified sampled from the matched cluster.

Survey information
- Contains nationally representative estimates of how, where, and with whom Americans spend their time
- Covers ~200,000 interviews conducted from 2003 to 2018
- Only non-holiday weekday data is included here resulting in ~100,000 interviews
- Can be linked to Current Population Survey for detailed household demographic information
- Sponsored by the Bureau of Labor Statistics and conducted by the Census Bureau
Limitations
- The American Time Use Survey measures primary activity so some activities are not accurately captured. For example, listening to music is rarely recorded because typically it is a secondary task. If I’m listening to music, I’m probably also doing housework or cooking.
- The data is self reported so standard biases apply
- The clustering process aims to provide distinct clusters representative of common sequences so they may not be representative of all types of sequences. Combined with the two-step algorithm specified above, some day types may not be matched well. Notably, the use of the Levenshtein distance in the front-end is incongruous with the dynamic Hamming method in the analysis. Once time allows, I may write my own dynamic Hamming distance function in JavaScript.
- The above distributions are not representative of all people that do those activities, just the top 25 people most similar to you
- The raw time-use data details each minute of the respondent’s day by mapping it to a list of 465 activities. I aggregated these 465 activities into 15 activities based on the Bureau of Labor Statistics’ (BLS) hierarchical definitions and my judgment. Every half hour is reduced to its respective modal activity. This results in some loss of information but severely decreases the distance matrix size.
Software thanks
- D3.js and JavaScript for interactive visualizations
- R for analysis
- TraMineR for edit distance calculations
- fastcluster and NbClust for clustering
- tidyverse for data munging and ggplot2 for static visualizations
2021 January
Find the code here: github.com/joemarlo/ATUS-similarity